I'm living in Osaka, Japan and wanted to know the relation between latency and region distance, and pricing.
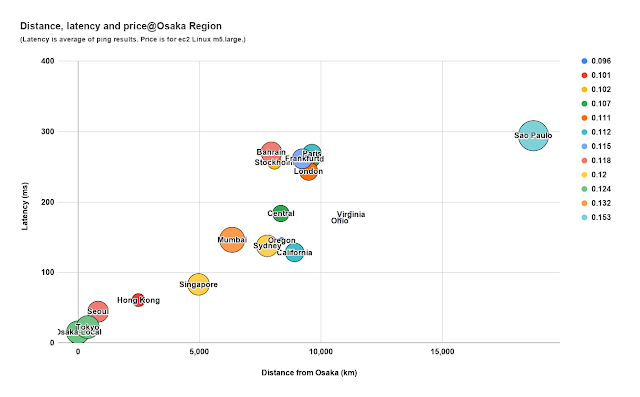
The figure below is a bubble chart with distance from Osaka and latency. This is a very rough search but somehow showing interesting results for me.
Condition
Distance is just a direct distance from city to city, obtained from google search "distance from Osaka to XXX" (not data centers).
Latency is ping result from here: https://www.cloudping.info/
Price is for ec2 m5.large instance.
Regions in US Gov and China are not included.
Results
The relation of distance and latency is mostly linear. This is not surprising nor notable. But for EU regions like London, Paris is rather showing high latency. This might be my searching way of distance is for just a direct distance, therefore it is not fit the real data sending paths.
NOTE: This is the google result of "distance from Osaka to London" ... showing the direct path through the deserts of China, Kazakhstan. (It cannot be?)
For the question which region is cost-effective if latency is not a high priority, Hong Kong Region is 10% lower with x4 latency. And Oregon Region is 20 % lower price x 10 latency. If latency is acceptable, or if you can do all things within other regions, I think choosing these lower-priced regions works.
| Region | Distance | AVE-Latency | Price |
| Asia Pacific (Osaka-Local) | 0 | 15.0 | 0.124 |
| Asia Pacific (Tokyo) | 400 | 22.3 | 0.124 |
| Asia Pacific (Seoul) | 828 | 44.3 | 0.118 |
| Asia Pacific (Hong Kong) | 2,487 | 60.7 | 0.101 |
| Asia Pacific (Singapore) | 4,963 | 83.0 | 0.12 |
| Asia Pacific (Mumbai) | 6,344 | 146.3 | 0.132 |
| Asia Pacific (Sydney) | 7,792 | 137.7 | 0.12 |
| Middle East (Bahrain) | 7,960 | 270.3 | 0.118 |
| Europe (Stockholm) | 8,086 | 256.3 | 0.102 |
| Canada (Central) | 8,350 | 183.7 | 0.107 |
| US-West (Oregon) | 8,386 | 145.3 | 0.096 |
| US-West (California) | 8,917 | 128.3 | 0.112 |
| Europe (Frankfurt) | 9,231 | 261.3 | 0.115 |
| Europe (London) | 9,493 | 243.7 | 0.111 |
| Europe (Ireland) | 9,616 | 261.0 | 0.107 |
| Europe (Paris) | 9,628 | 268.7 | 0.112 |
| US East (Ohio) | 10,777 | 173.0 | 0.096 |
| US-East (Virginia) | 11,246 | 182.3 | 0.096 |
| South America (São Paulo) | 18,747 | 294.0 | 0.153 |
Conclusion
Relations between AWS Regions, latency, and pricing are calculated easily by getting data. Latency is almost dependent on distances from the client. It will work when the most cost-effective architecture is required.
===
In the blog post of classmethod.jp, a comparison of Athena query time between Tokyo region and Virginia region.
data: S3 in Tokyo Region, 387.7MiB of 1.35 million records.
Query time :
Tokyo Region: 17.93sec, 17.97sec, 17.55sec
Virginia Region: 23.07sec, 23.62sec, 21.63sec


